Google Search Console (GSC) can be a highly beneficial tool for improving your website’s SEO performance if you know how to use it. You can use it to review the user experience of your site, how it performs on Google, find indexing or sitemap issues, and more.
However, many users initially find Search Console confusing because of various metrics and different reports.
That’s why we’re here to help – keep reading to find out the ultimate guide on how to use Google Search Console. We’ll teach you how to set it up, find various reports, and leverage them to fix issues.
Manage sitemaps and enhance your site's SEO – all with one app
Try TinyIMG freeWhat is Google Search Console?
Google Search Console is a free tool provided by Google that is used to monitor how your website performs on Google Search and help you improve rankings.
GSC gives you various reports that you can use to analyze anything from user experience and technical SEO issues to your indexed site pages, search appearance, and more.
How to set up Google Search Console?
Setting up GSC may seem confusing at first, but following a step-by-step tutorial will make it effortless. Keep in mind that you’re required to have a Google Account to access the Search Console. So, the first step is to create a new account or log into an existing one.
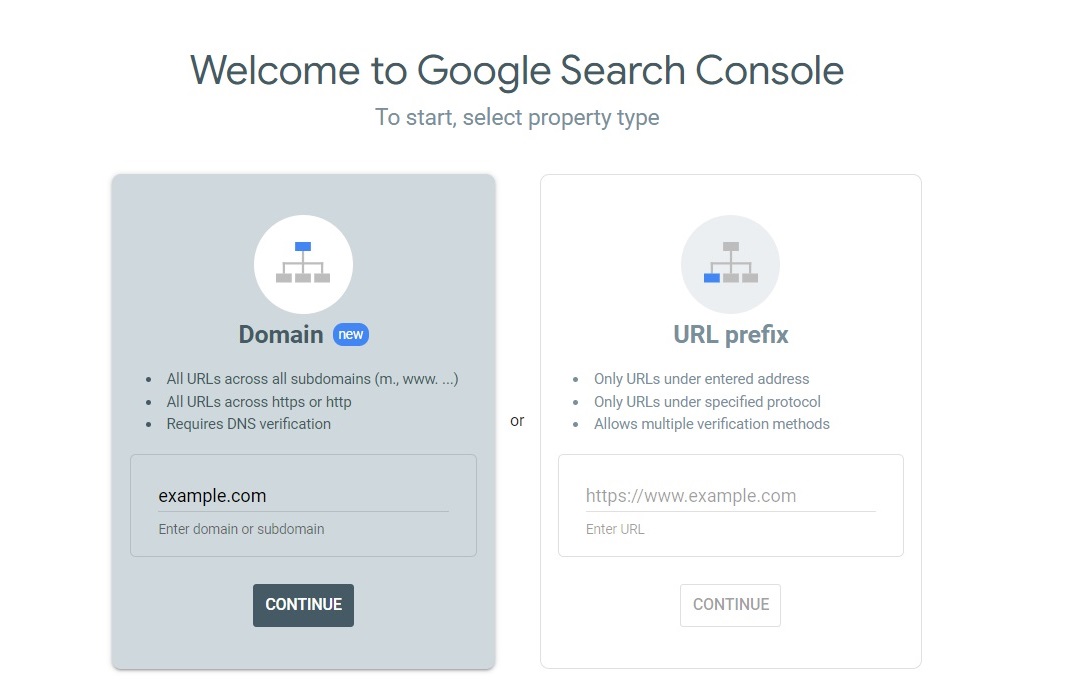
Next, you’ll have to verify your website on Google Search Console. There are two ways – adding your site’s domain or URL prefix.
By adding a domain property, you’ll be able to analyze the whole site content, including subdomains. Meanwhile, adding a URL prefix property will let you examine only a part of your website.
Method 1: Add a domain property
If you wish to monitor your whole website, you’ll have to add a domain property. So, here’s how to verify your website on GSC:
1. Open Google Search Console.
2. Insert your website’s domain and click Continue. Make sure you only insert the name and the top-level domain (e.g. .com). Skip the HTTPS and www. parts of the URL. For instance, it could look something like this: “examplesite.com.”
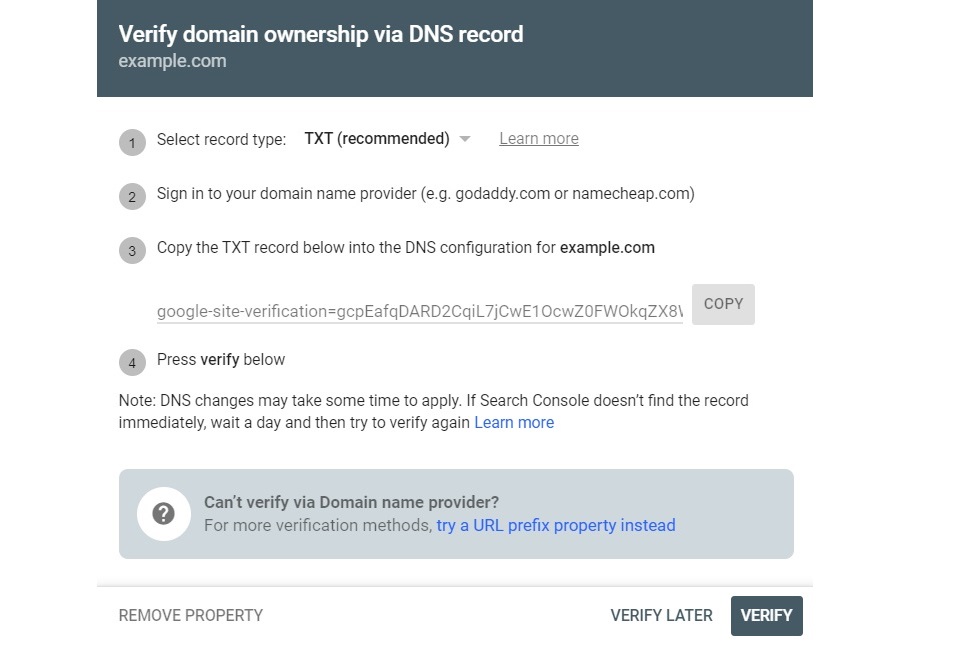
3. You’ll see a window with instructions on what to do next. Copy the TXT record but don’t click Verify just yet.
4. Open a new window, go to your domain registrar, and sign in.
5. Access the DNS records. You can usually edit DNS in the Domains section, but check with your provider for accurate instructions.
6. Set the record type to TXT, add the name or host as “@” and insert the copied record into the TXT Value field. You can see an example of how it looks like with Hostinger below.
7. Go back to the Google Search Console window and click Verify.
If you get a message that “Ownership verification failed,” it could be that the added record hasn’t been propagated yet. You can head to Whatsmydns.net, add your domain, set the record type to TXT, and check if the map is covered in green checkmarks.
Keep in mind that record changes can take up to 48 hours. So, check again in some time, and once everything is covered in green, go to GSC and click Verify again.
Method 2: Add a URL prefix
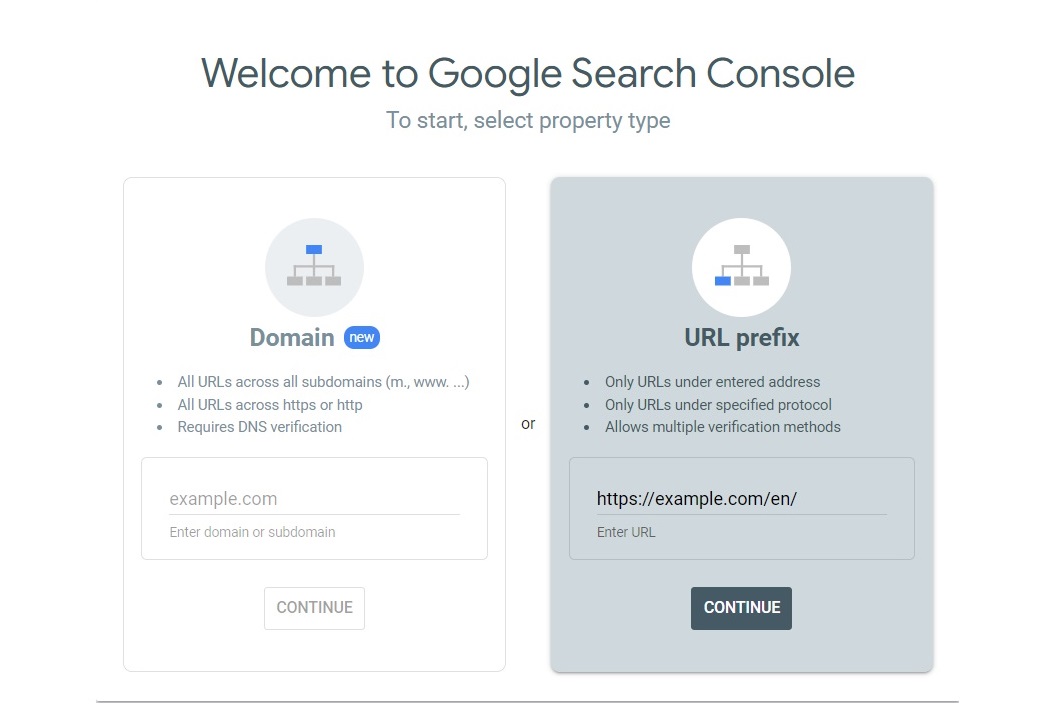
Let’s say you only want to analyze a specific part of your website, such as examplesite.com/en/ or a blog. Then, you need to create a URL prefix property. Let’s take a look at how to do it:
1. Open Google Search Console.
2. Enter the full URL of your website, including HTTPS and www. parts. For example, “https://www.examplesite.com/en/.” Click Continue.
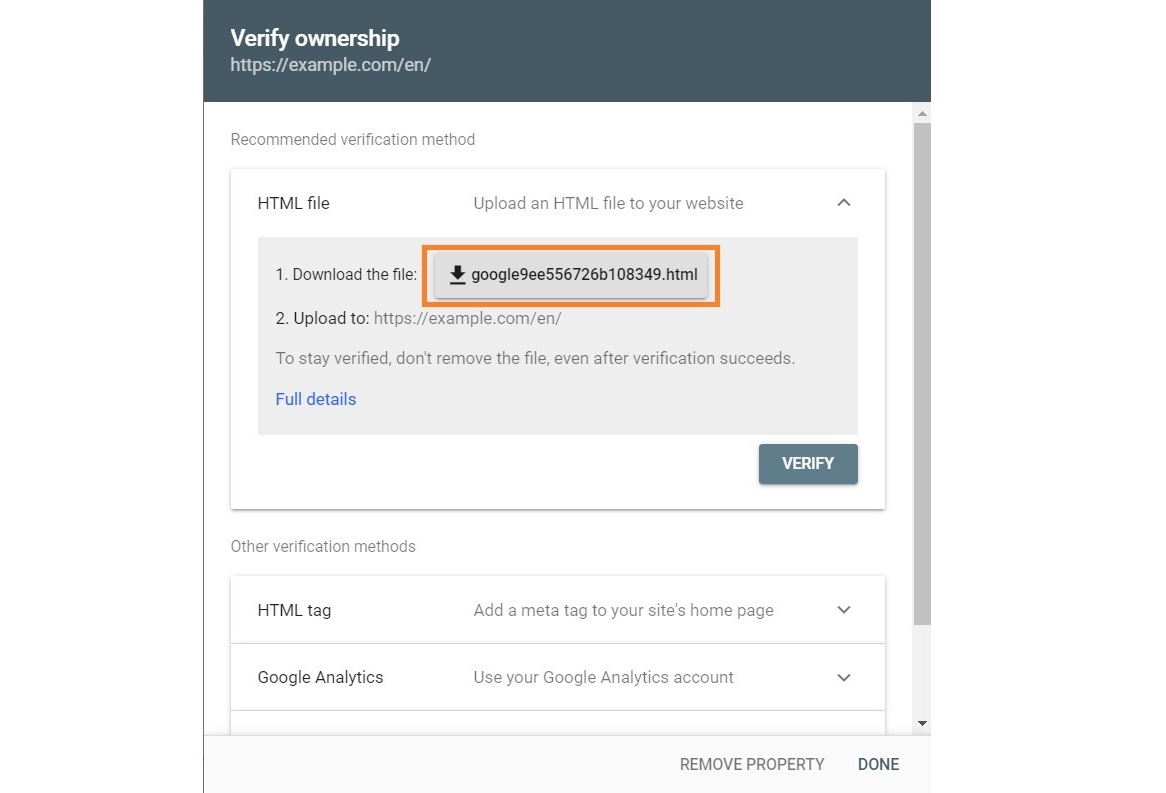
3. You’ll get multiple verification method choices, including HTML file, HTML tag, Google Analytics, and others with clear instructions. The recommended option is the HTML file, so let’s expand this section.
4. Download the provided file as per the instructions on the window.
5. Upload the verification file to the root directory of your website. For example, the root directory for the URL “https://www.examplesite.com/en/” would be “/en/.”
6. Come back to the GSC window and click Verify.
Remember that changes might take a while, so if verification fails, wait some time and try again.
GSC account roles and permissions explained
There are two main roles in Google Search Console – owner and user. However, these roles can also be distinguished into different types of owners or users. So, let’s take a look at all types of account roles and their permissions.
Owner
An owner is a person who has full control over the Search Console property and can view data, use any tool, add or remove users, and more. There must be at least one verified owner on a property.
There are two types of owners:
- Verified owner. It is a person who verified ownership using a token like an HTML file. Verified owners can be removed by deleting the token on the website.
- Delegated owner. This is a person who has been granted ownership status by a verified owner. Delegated owners can be removed by any owner in the user management section of Google Search Console.
User
Differently from owners, users can access Google Search Console but have limited rights. There are three types of users:
- Full user. They have rights to all data on GSC and are allowed to take some actions.
- Restricted user. They have restricted viewing and action rights.
- Associate. These can be people or accounts that can take action on behalf of your site but cannot access your GSC property directly.
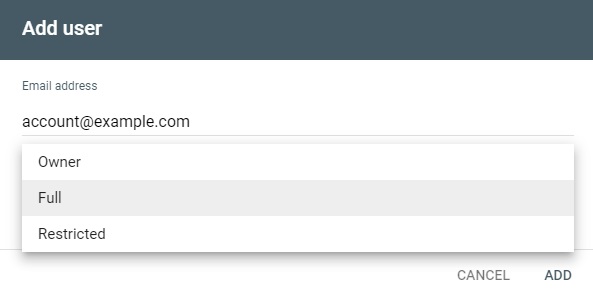
To add or remove a user, you have to open GSC and head to Settings > Users and permissions.
Click Add User at the top right corner of the window, enter the person’s email address, and select the role type.
Click Add and the new person will be added.
How to add a sitemap to GSC?
A sitemap is an XML file, or a text file, that contains all of your website URLs. It’s useful for new pages to be found and crawled by Google quicker and more often. So, if you edit your pages, the new version is likely to be crawled faster.
A Shopify sitemap is generated automatically, and you can view it by adding /sitemap.xml to your website URL. For example, “www.examplesite.com/sitemap.xml.”
If you don’t add a sitemap to Google Search Console, your website will still be crawled and indexed. However, submitting it can ensure it happens faster. Here’s a quick guide on how to add your sitemap to GSC:
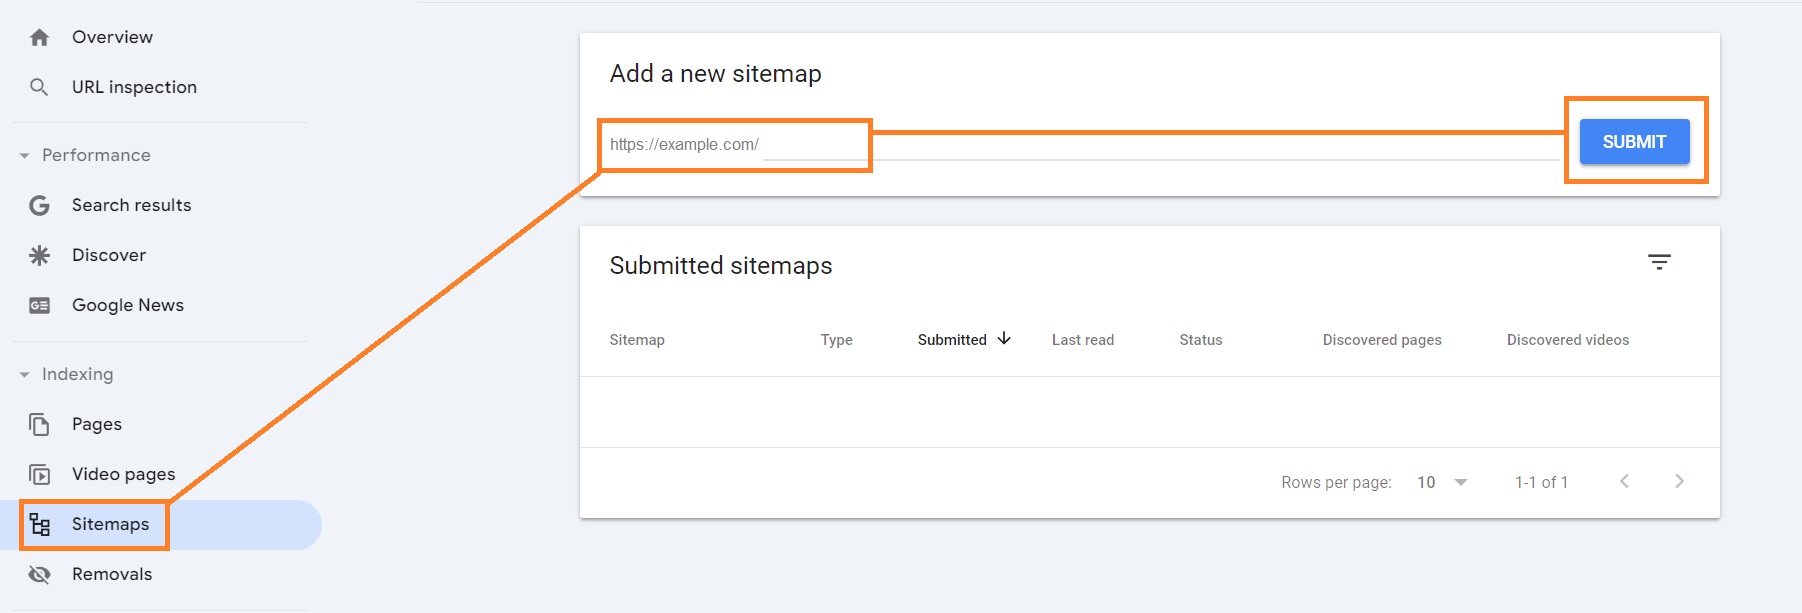
1. Open Google Search Console and click Sitemaps.
2. Under the “Add a new sitemap” section, insert your sitemap’s URL, and click Submit.
3. You will receive a confirmation message once your sitemap is processed.
To manage your sitemap, you can use an SEO tool like TinyIMG. It lets you hide pages from sitemaps and search engines with a click of a button.
Google Search Console Performance report
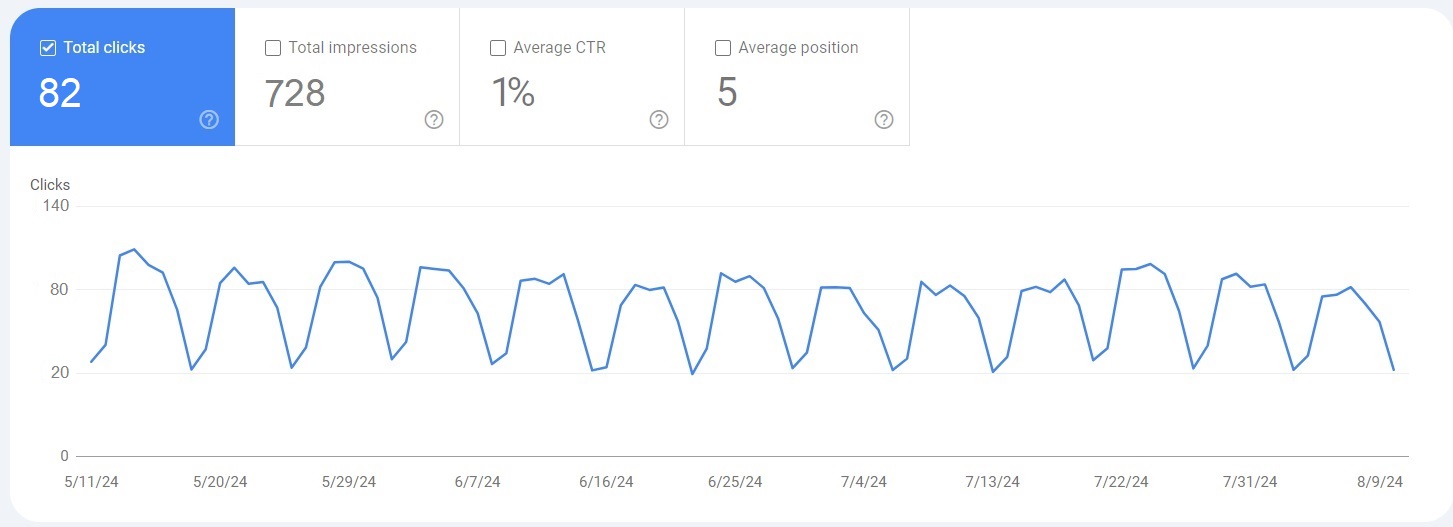
The GSC Performance report shows how your website performs in Search results. You can find it on your GSC property by logging into your GSC account, selecting your property, and opening the Performance section on the left side of the window.
But to understand what the report demonstrates, you need to comprehend a few metrics and their meaning first, such as queries, impressions, clicks, average position, and CTR.
Queries
Queries are specific keywords or search terms that help users find your website. In other words, they are terms that generate impressions for your website on SERP (Search Engine Results Page).
You can use this data to understand what search terms are making your website gain traffic and optimize your website accordingly.
Impressions
Every time any page URL of your website appears in Google search results that were viewed by a user, it counts as an impression. However, this does not include paid Google Ads search impressions.
Even if the user doesn’t scroll down the Google search result page to find your website, it still counts as an impression.
Clicks
Clicks show how often someone clicks a link to your website on Google search results. Clicking on the website, returning to the search page, and clicking the same link again counts as 1 click while clicking a different link on the same website will count as another one.
Keep in mind that this metric doesn’t include paid Google result clicks.
Average position
The average position in Google Search Console is the average ranking of your link in Google Search.
A position shows where your website link was seen in search results. For example, 1 is the top position, while 2 is the next, etc.
Meanwhile, the average position metric in GSC averages the position value for all impressions because positions change every time they’re seen.
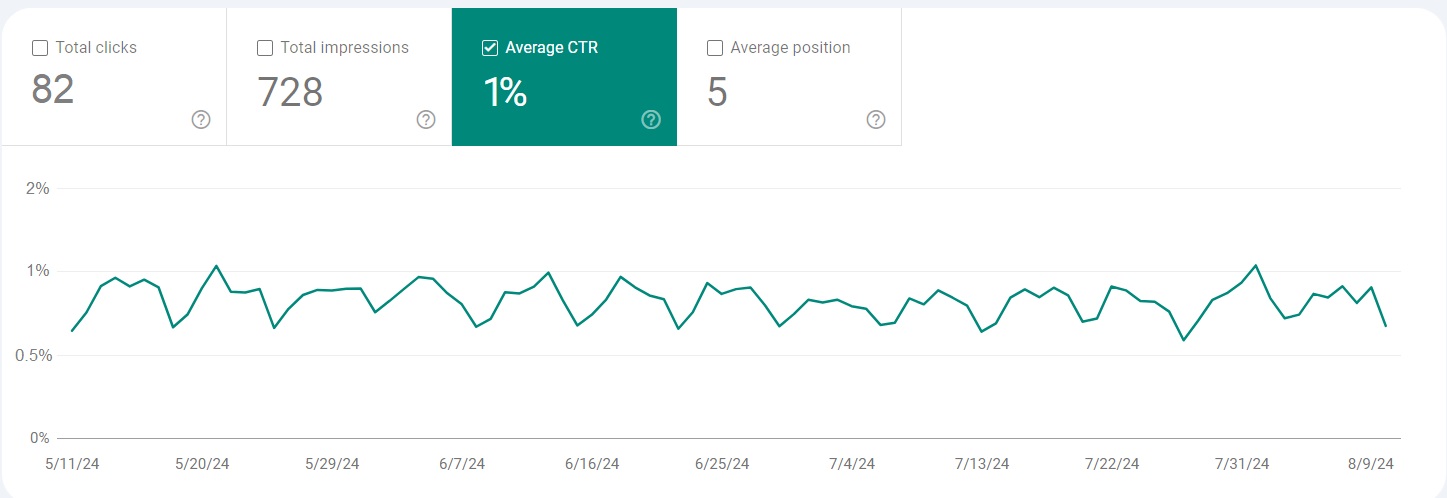
CTR
CTR (Click-through rate) is the number of clicks on your page divided by the number of times your page is displayed and presented in percentage.
The complete formula looks like this:
Clicks ÷ impressions * 100 = CTR
For instance, if your page shows up in search results 50 times and you get 10 clicks, then your click-through rate would be 10 ÷ 50 * 100 = 20%.
How to filter Google Search Console data?
To filter Google Search Console data, all you have to do is open a report and click the +NEW label which you’ll find at the top of the report in the Filters section.
There are multiple ways you can filter Google Search Console data, here are some of them:
- Search type. You can filter data based on the search you want to explore, including Web, Image, and Video. If you want to compare two traffic types, click the “Compare” tab.
- Date range. GSC allows you to select any date range to analyze your website or even compare different date period reports.
- Other filter types. You can also click the +NEW label and select other types of filters, including query, country, search appearance, or device. Plus, it’s also possible to add a few filters for deeper website analysis.
How to use the GSC URL inspection tool?
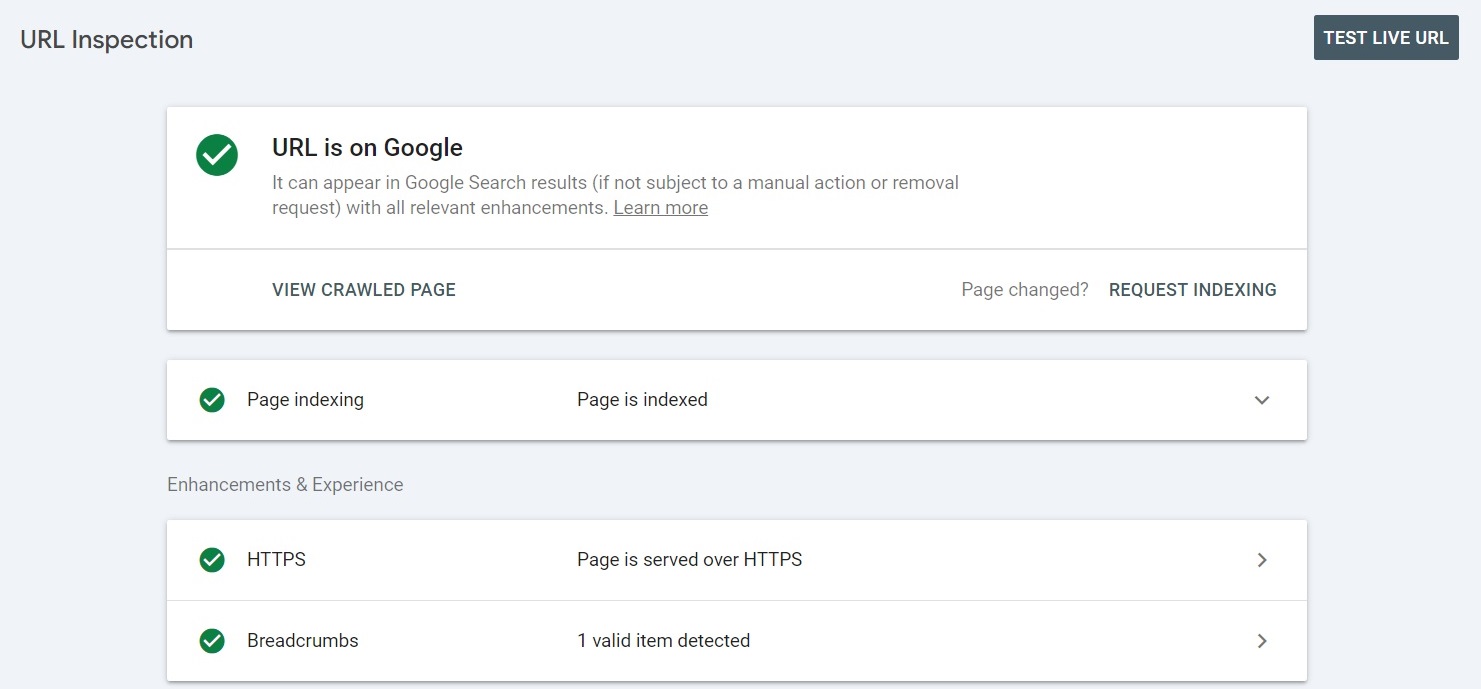
The URL inspection tool on Google Search Console gives you information regarding a specific page on your website, such as structured data details, videos, and more. It helps you test whether a URL can be indexed and troubleshoot any issues.
You can access the URL inspection tool in two ways:
1. Open the property of your website and simply insert the full URL of the web page you want to inspect into the search bar of Search Console.
2. You can click the Inspect icon (magnifying glass icon) by the URL you want to troubleshoot in any of the GSC reports. If you can’t see the icon, try hovering over the URL.
Whichever method you choose, you’ll be able to view whether the URL is indexed, optimized for mobile, includes structured data, and its last crawl date.
Here are some of the useful tasks you can do with this tool:
- If your page isn’t indexed, you can speed up the process by clicking the “REQUEST INDEXING” button.
- To check the current page version by clicking “TEST LIVE URL.” This comes in handy if you’ve altered the page before the listed crawl time.
- You can view your page resources, code, and other information by clicking “VIEW CRAWLED PAGE” and heading to “More info.”
How to check indexed pages and index errors?
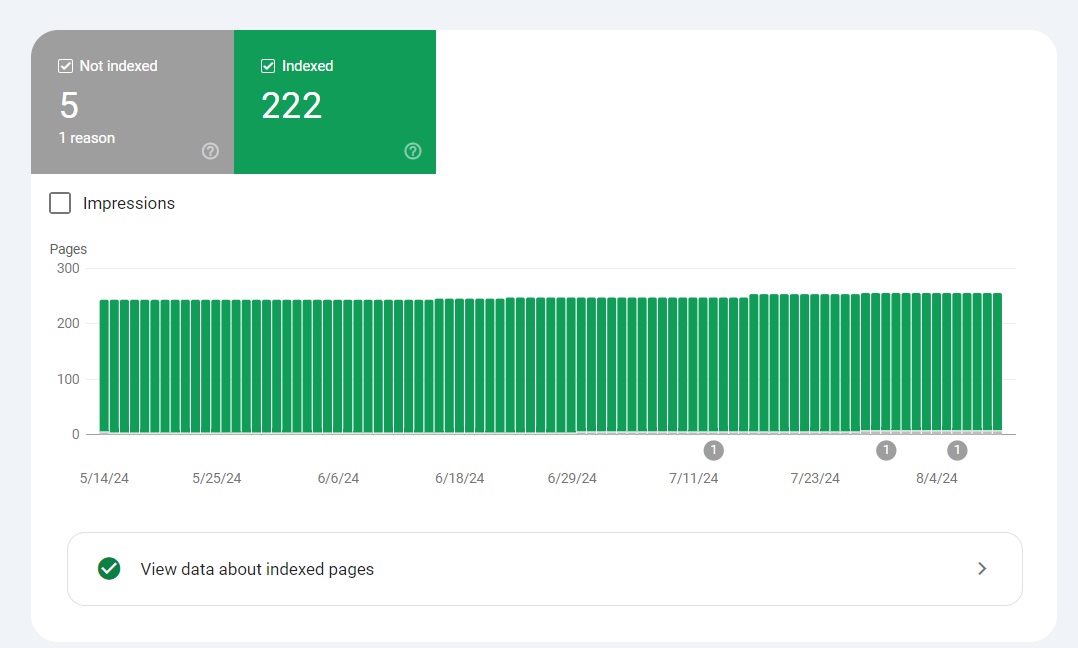
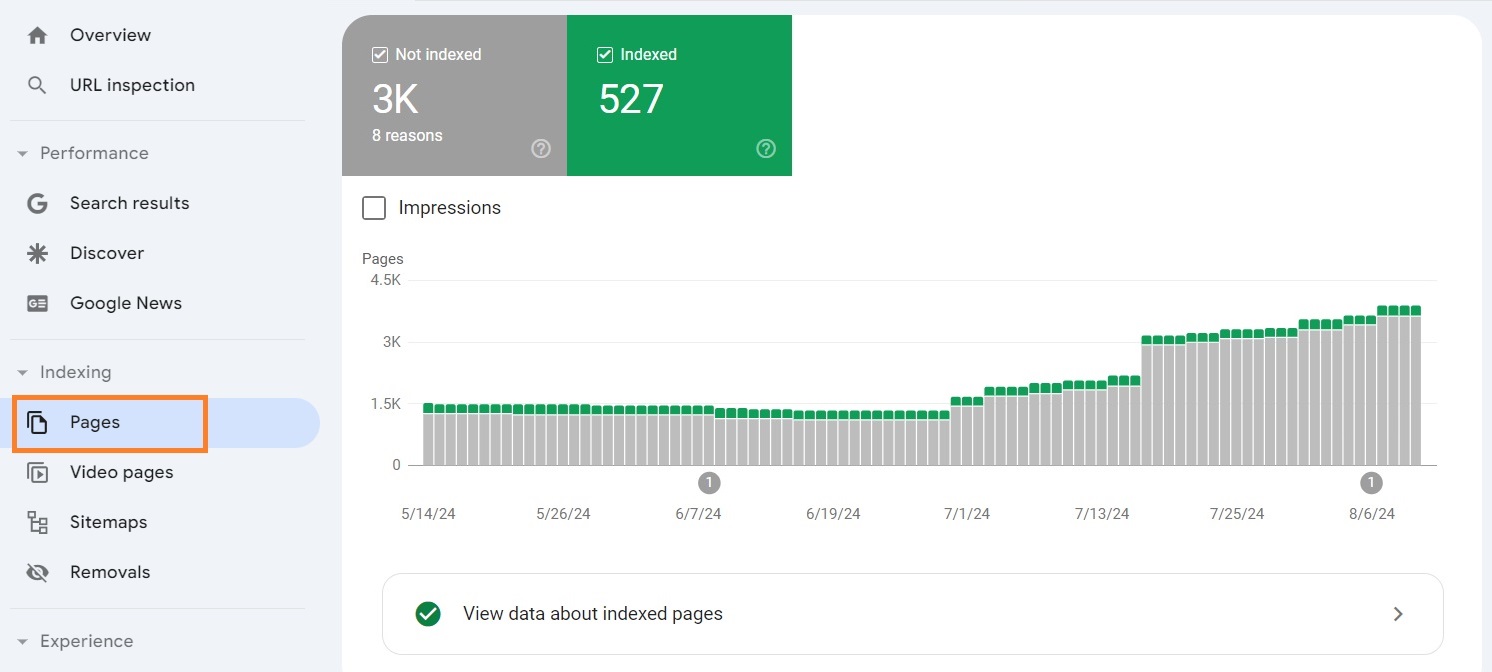
Google Search Console makes it really easy and convenient to check page indexing and identify issues using the Page indexing report. To access this report, open your GSC property and head to Pages under the Indexing section.
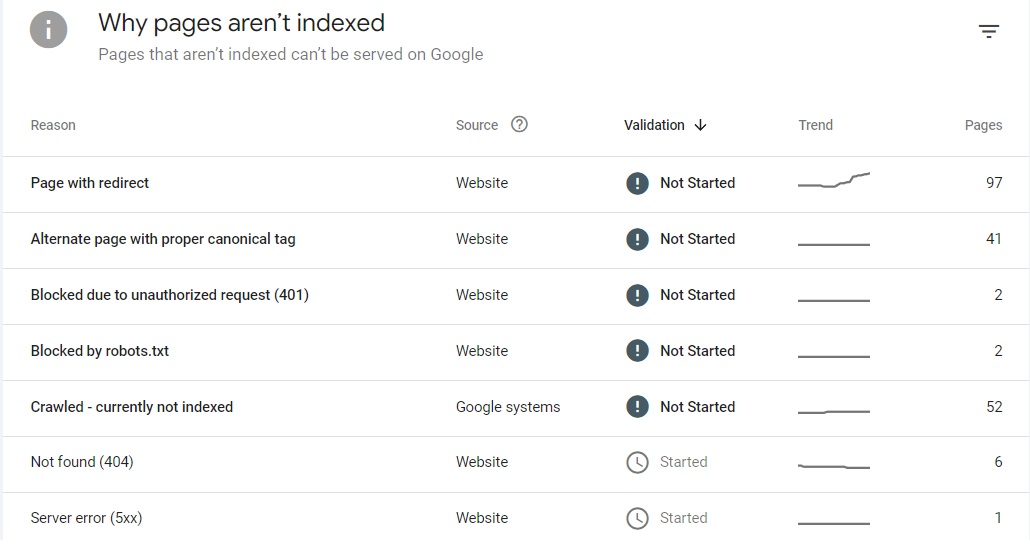
In this section, you’ll see two numbers – indexed and non-indexed pages. You can scroll down to the “Why pages aren’t indexed” section to see the reasons for non-indexed pages.
You may need to remove noindex tags, delete duplicate content, fix broken links, and more. Once you click any of the provided reasons, you’ll get a list of pages with such issues.
Each section will come with a “LEARN MORE” button which you can click to find out how to fix specific issues. When you’re done fixing them, you can click the “VALIDATE FIX” button.
How to use the Page Experience report?
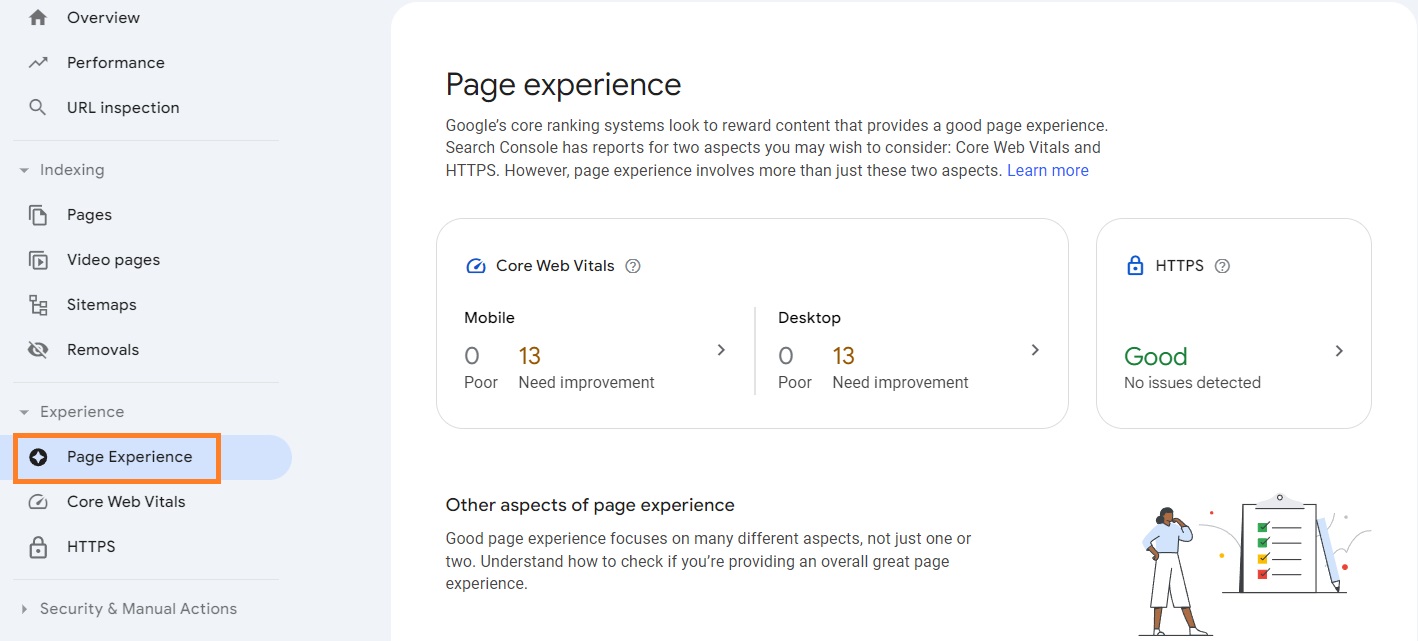
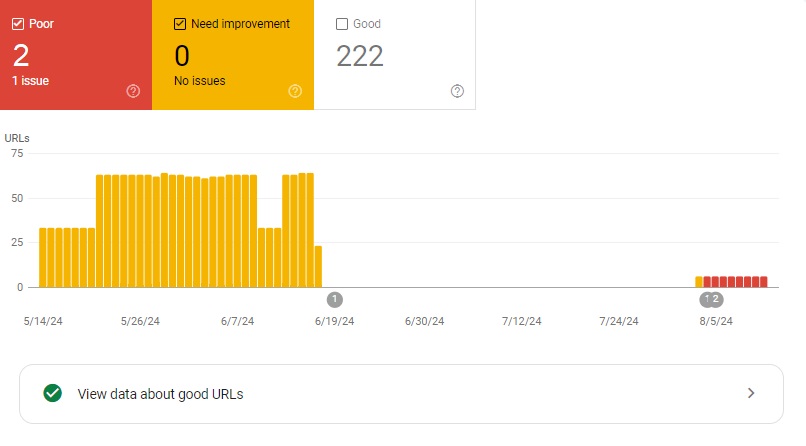
The Page Experience report will show you a summary of the user experience on your website. It’s evaluated per URL and helps you improve the visitor experience on your site. You can find it by clicking the Page Experience section on the left sidebar.
The Page Experience report includes such criteria:
- Core Web Vitals. It includes the speed, responsiveness, and stability of your page performance. The ratings range from Good to Needs improvement or Poor. For the page experience to be considered “Good,” it has to have the “Good” rating in stability and speed and “Good” (or not enough data) in responsiveness.
- HTTPS usage. A page must be HTTPS instead of HTTP to be considered “Good.”
Keep in mind that this applies not only to desktop but mobile web pages. If any of the sections are marked red, you can click on them to see details of the full report. For example, the Core Web Vitals section will show you how many pages have Poor, Needs improvement, or Good ratings.
You can then scroll down to the “Why URLs aren’t considered good” table to find exact issues. You can click on any of the reasons to see which pages have the same problems and fix site speed issues.
If you’re not experienced with Core Web Vitals, you may need additional help from your developers. Once you fix all of the issues, you can click “VALIDATE FIX.”
What does the GSC Sitemaps report show?
The Google Search Console Sitemaps report lets you add new sitemaps, check submission history, and find errors with parsing your sitemaps.
You can find the Sitemaps report by simply going to “Sitemaps” on the left sidebar.
Here you’ll find a section to add a new sitemap and a table with submitted sitemaps. The latter will show you the URL and type of your sitemap as well as its submission date, last read date (the last time Google crawled it), and how many pages are in the sitemap.
The most important part is the Status column – if it reads “Success,” it means your sitemap was successfully processed.
However, if it reads “Has errors” or “Couldn’t fetch,” you’ll have to identify issues and fix them. You can open the sitemap by clicking on it and investigate further. Here’s what you can do:
- Fetch errors. If your sitemap wasn’t fetched, head to the URL Inspection tool and perform a URL test. You might have redirect or compression issues, an empty sitemap, a file size error, or more.
- Parsing errors. If there are errors present on your sitemap, you can click on the sitemap row, check what errors are present, and review how to fix them in the Search Console Help.
Once you click on the sitemap, you’ll be able to see more details about it. Then, click “SEE PAGE INDEXING.”
This will lead you to a report that will show you a graph with Indexed and Not indexed pages.
What is the GSC Enhancements report?
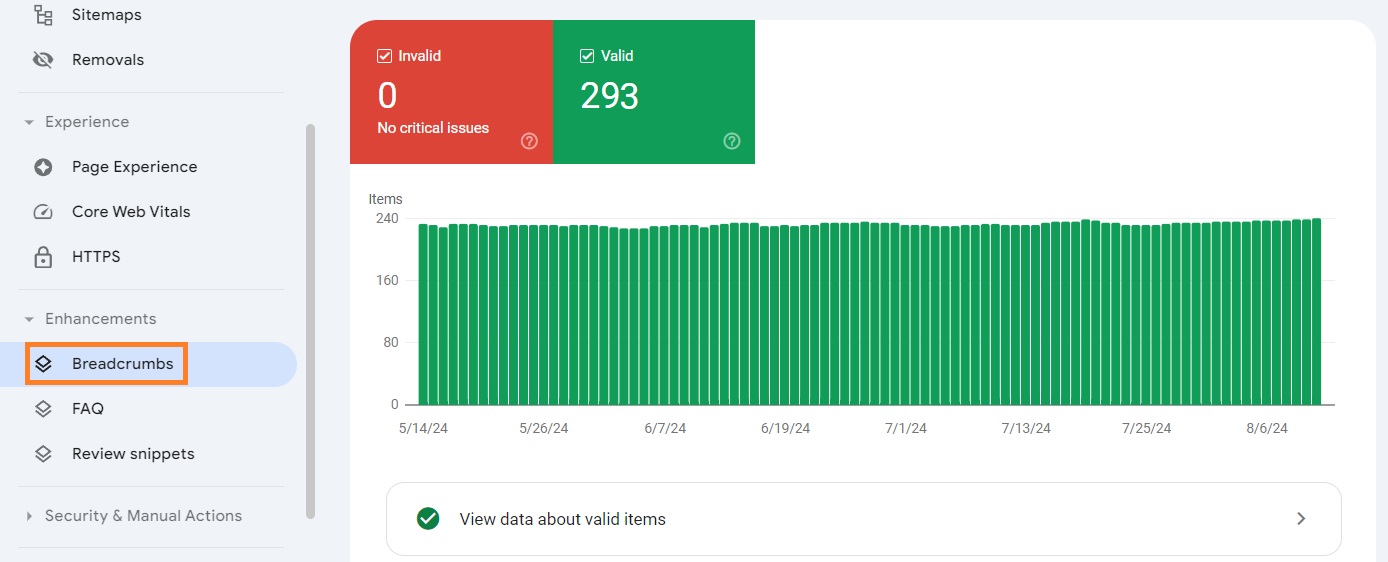
The Enhancements report lets you track the performance of your site’s structured data. You can find specific reports under the Enhancements tab on the left sidebar.
Here, you can learn the number of pages that have structured data on your website, the types of structured data, and the number of times your website appears in a rich result.
Let’s say you click the Breadcrumbs section and find a value greater than 0 under the “Invalid” section. You can scroll down the window to find more details and filter out valid items to identify issues.
Then, you can go to your website, fix the found issues, and once you come back to the Google Search Console window, click “VALIDATE FIX.”
Conclusion
Using Google Search Console may seem confusing at first, and that’s why it’s crucial to not skip understanding the meaning of main metrics, learning how to use specific reports and other tasks.
To make Google Search Console easy, you can easily connect it with the Shopify TinyIMG app. It lets you manage sitemaps, access the GSC Performance report straight from your Shopify Admin dashboard, fix SEO issues, and improve speed.

Frequently asked questions
Google Search Console allows you to monitor your website performance on Google Search and monitor it for any server, performance, or security issues. It’s also great for ensuring website maintenance or changes don’t negatively affect search performance.
You can practice Google Search Console by identifying pages with high traffic, inspecting your pages with URL Inspection tool, identifying crawl errors, and monitoring your site’s performance metrics, such as impressions or average position.
You can improve your website’s SEO with Google Search Console by monitoring traffic and keyword ranking, checking if pages are properly indexed, analyzing backlink data, including internal and external links, and identifying user experience issues for mobile users.
To access your Google Search Console, head to the GSC homepage, click the “Start Now” button, enter your email and password, and click Sign in.

