Using Google Analytics 4 (GA4) for SEO can help you get valuable insights into your website performance. From finding popular content that doesn’t perform well anymore to discovering engagement and conversion opportunities – you can do it all.
But with so much data and reports, GA4 can become challenging to navigate. To help you out, we prepared 5 ways you can use Google Analytics 4 for SEO step by step. We’ll also show you how to improve SEO using your findings, how to analyze results, and more.
Optimize your Shopify website for better speed and automate SEO tasks
Try TinyIMG todayHow to set up Google Analytics for SEO?
When using Google Analytics 4 for SEO, you first need to set it up correctly so that you can see site data. Here’s a step-by-step guide on how to set it up to see Site Search data:
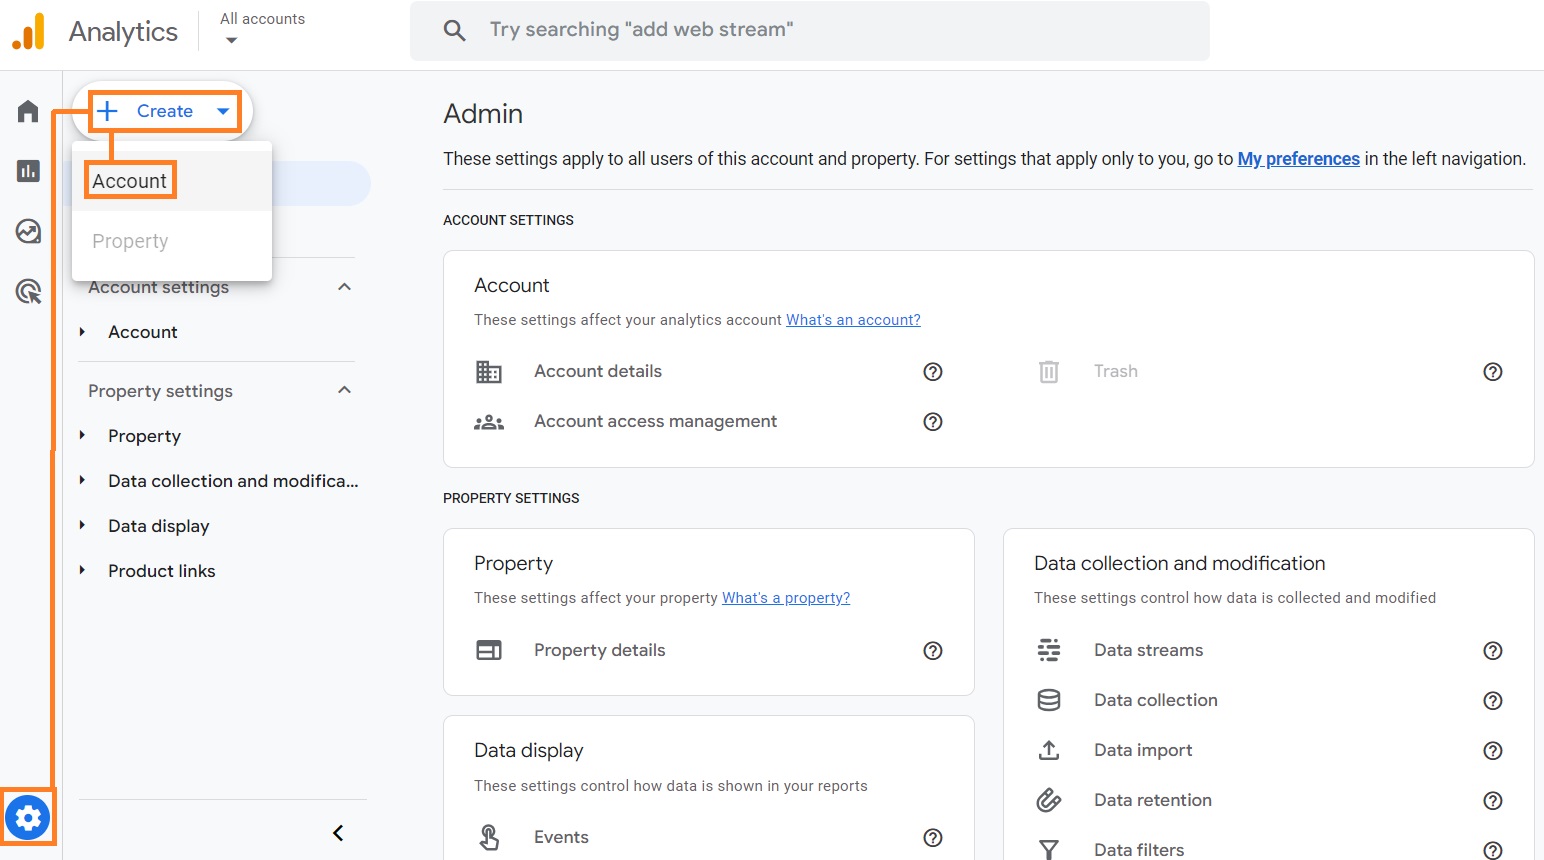
1. Go to Google Analytics, click Admin > Create > Account.
2. Insert your account name and click Next.
3. Enter your details, such as property name, time zone, currency, business size, and industry category. Click Create.
4. Add a data stream in Admin > Data streams.
5. Click on your created data stream.
6. Under “Enhanced measurement,” press the gear icon to access settings and make sure Site Search is turned on.
7. Click Save.
The reason you need Site search measurements enabled is to get SEO insights. You can learn more on how to set up Google Analytics in the Analytics help guide.
How to link Google Analytics 4 with Google Search Console
It’s useful to connect Google Analytics 4 with your Google Search Console account. This way, you can get better insights into what keywords attract visitors to your site and what pages rank best on Google Search.
Here’s the easiest way to link GA4 with Google Search Console:
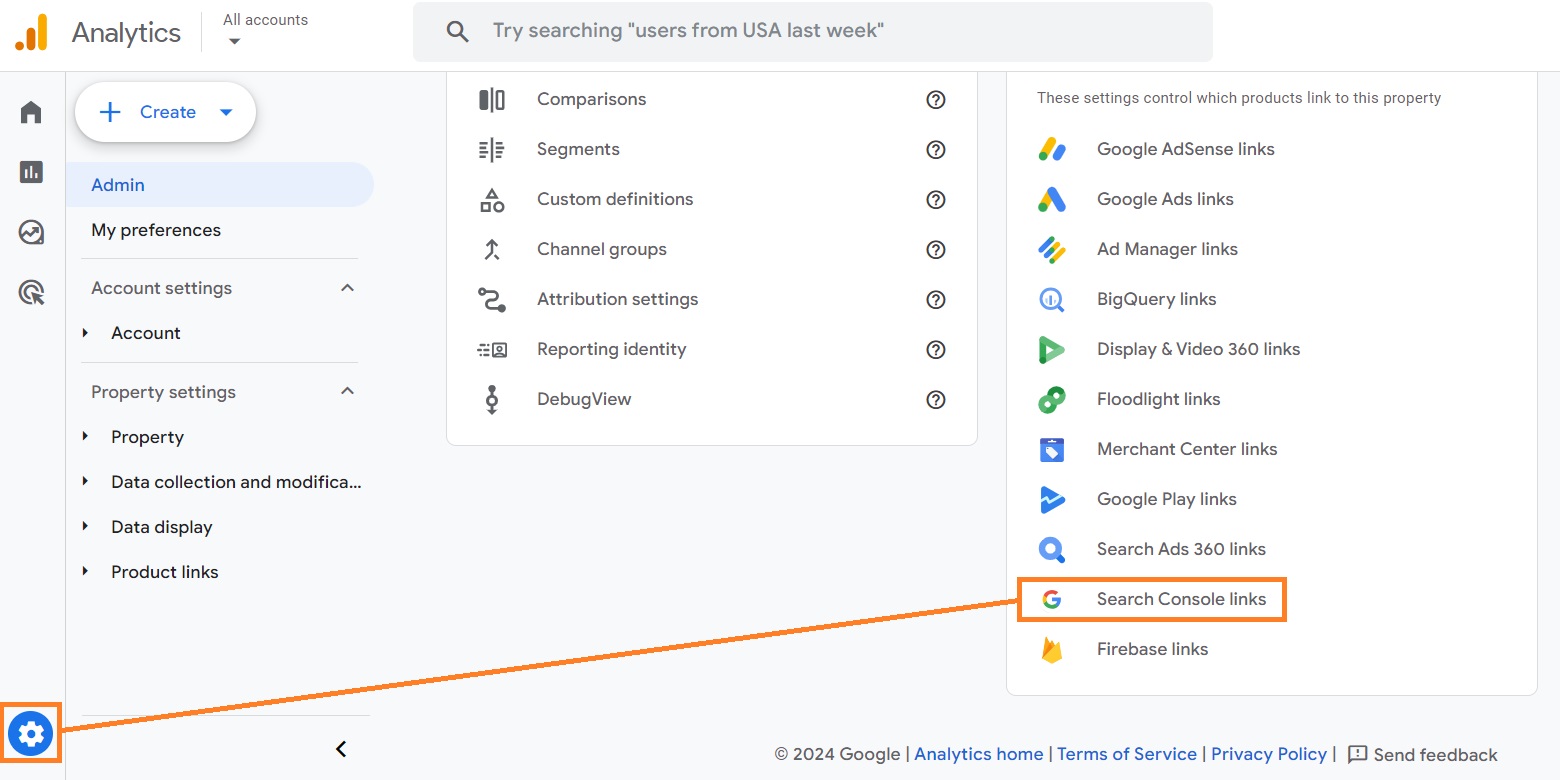
1. Open Google Analytics and click Admin.
2. Under the “Product links” section, click Search Console links.
3. Press the Link button (you must have admin permissions for that).
4. If you have more than one Search Console property, click Choose accounts under the “Choose Search Console property” section and pick the account that you want to link to.
5. Click Confirm and then press Next under the “Choose Search Console property” section.
6. Select the web data stream and click Next again.
7. You can click Submit.
If you go to the Reports section of your Google Analytics account, you’ll now be able to find Google Search Console reports under the “Search Console” section.
5 useful ways to leverage Google Analytics for SEO
Using Google Analytics for SEO can be valuable to find keywords to focus on and which pages you should be improving. This includes pages with sudden traffic drops, low-engagement or low-conversion to view count pages, and more.
Here are our top 5 methods on how to use Google Analytics for upping your SEO strategy:
Method 1: Identify content with a large traffic decline
If you don’t update pages long enough, their performance on search results is likely to decline over time. That can happen because information becomes outdated, competitors adopt better on-page SEO or create better content, or Google releases new algorithm updates.
If you have hundreds of pages on your website, keeping up with what to update can be challenging. That’s where Google Analytics comes to help.
Let’s take a look at how you can find content that doesn’t perform well on GA4:
1. Open Reports and head to Search Console > Google organic search traffic.
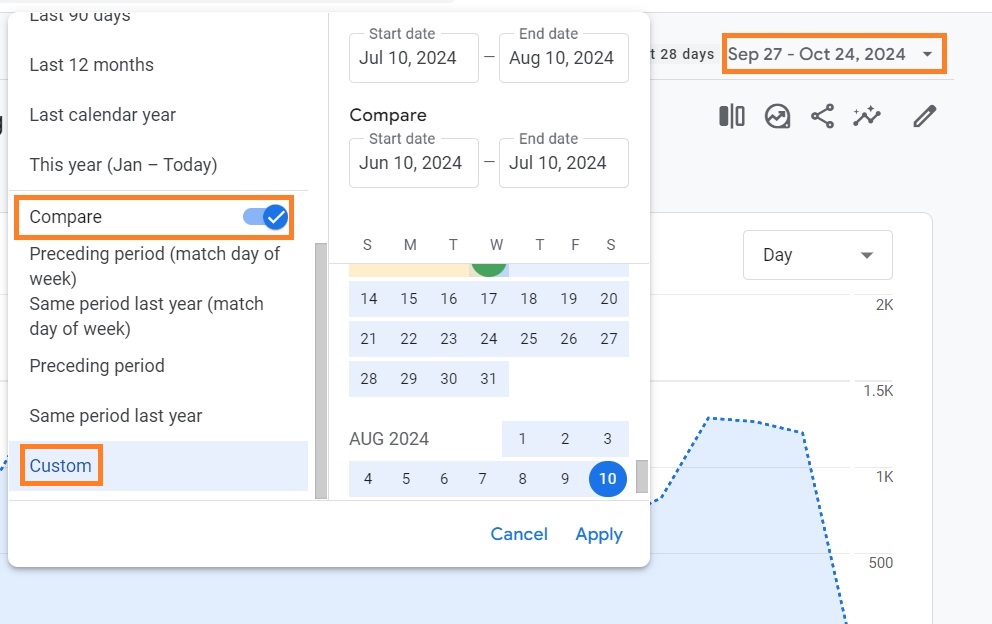
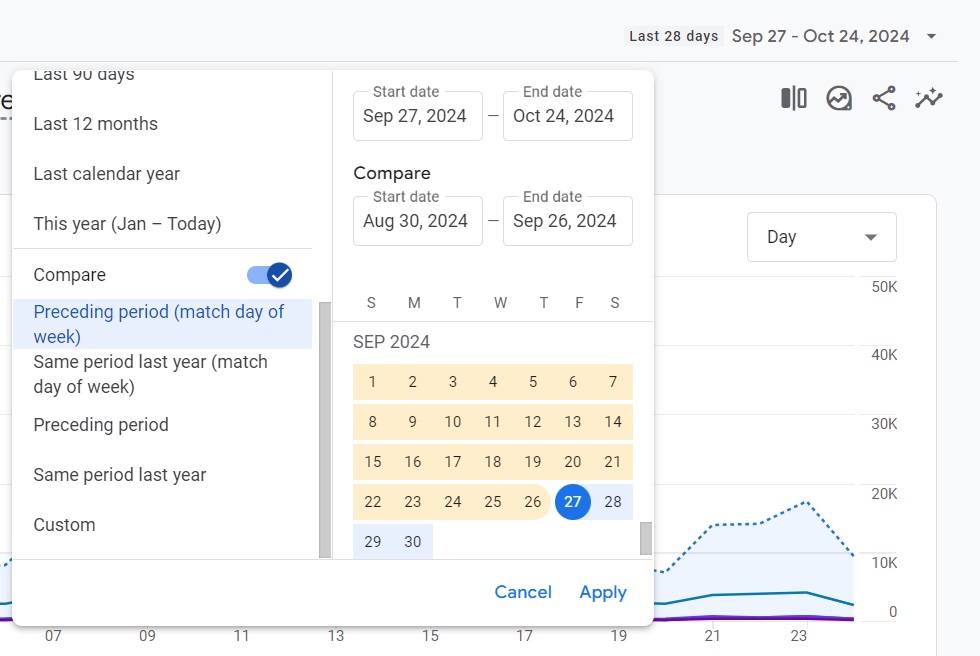
2. Head over to the date range section on the upper-right corner of the window and click it.
3. Scroll down and toggle on the Compare button.
4. Choose the Custom option and compare data from the last few months with the previous few months (same length) so that you get a more accurate change report.
5. Click Apply.
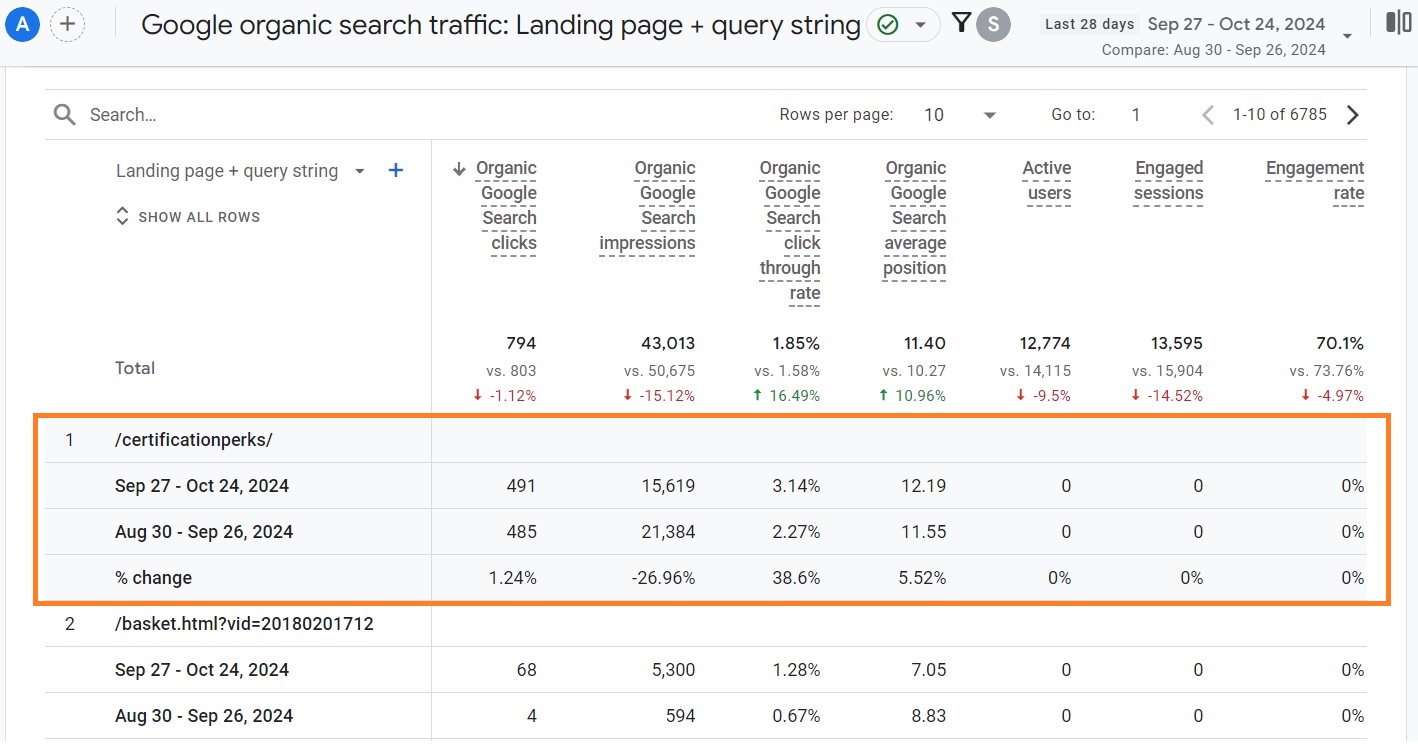
6. In the table below the Google organic search traffic graph, go through the pages and identify which ones have dropped in position under the “Organic Google Search average position” column.
For example, let’s take a look at the Google Analytics Demo store. As you can see below, even the first page in the table has dropped in clicks, impressions, and active users.
What this means is that there’s an opportunity to review your SEO practices on the page and improve these metrics. You can go through an on-page and technical SEO checklist and review whether you’ve optimized content with keywords, compressed visuals, ensured optimal speeds, and more.
Method 2: Optimize engagement on popular pages
Just because a page receives a high view count, doesn’t mean you shouldn’t touch it. Pages may get loads of traffic but lack engagement, meaning all those views can go to waste.
According to Analytics Help, an engaged session is one that lasts longer than 10 seconds and has a key event.
So, if lots of visitors come to your page but stay there for a few seconds only, it’s a sign that it could use some improvements.
You can check which pages receive a high view count but low average engagement time by following this guide:
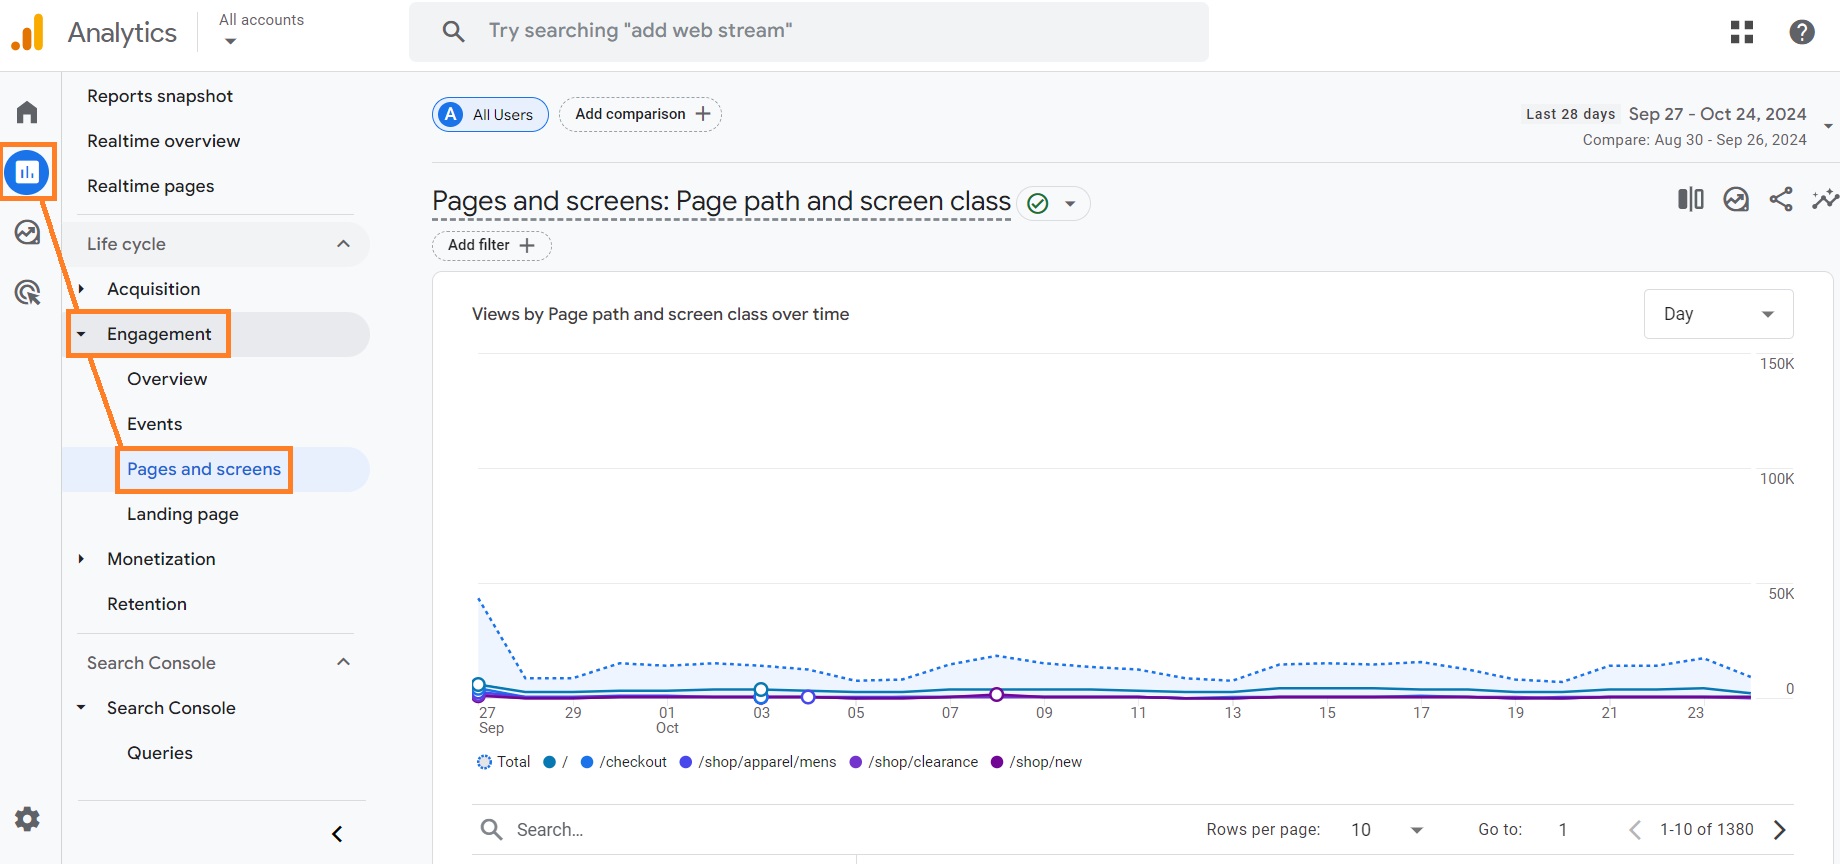
1. Click on Reports > Engagement > Pages and screens.
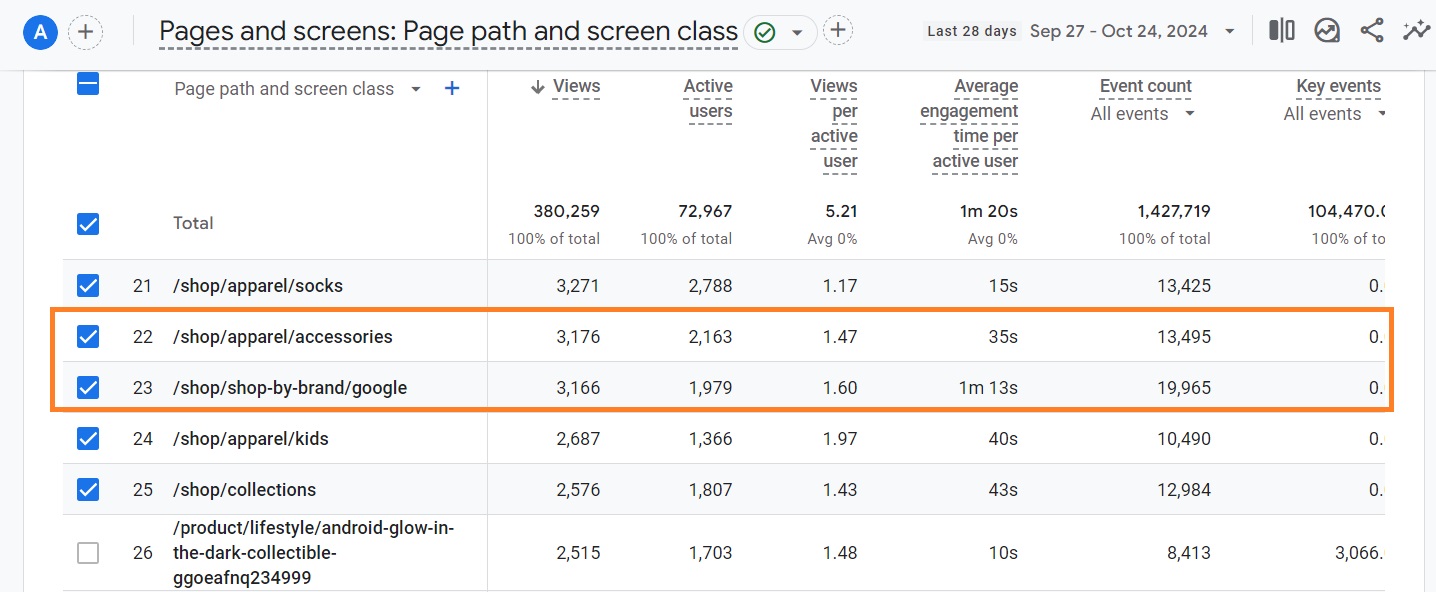
2. You can compare the Views and Average engagement time per active user by scrolling down to the table under the graph.
For example, the 22nd page in the table shows 3,176views in the last 28 days. On average, visitors leave it after 35 seconds. Meanwhile, the 23rd page in the table had only 10 less views but the average engagement time is 38 seconds longer.
This signals that the seond page could use improvements for either above-the-fold content, on-page SEO, design, or search intent.
Method 3: Optimize conversion rates on high-traffic pages
In Google Analytics, key events refer to events that measure actions that are crucial for your business’ success. Key events are simply conversions. Someone performing an important action on your website, such as adding a product to cart, is considered a key event.
If you haven’t used key events yet, you’ll need to set them up. You can learn how to do it using the quick Analytics help guide.
Once your key events are being tracked, you can identify pages with low conversion rates like this:
1. Head to Reports > Engagement > Pages and screens.
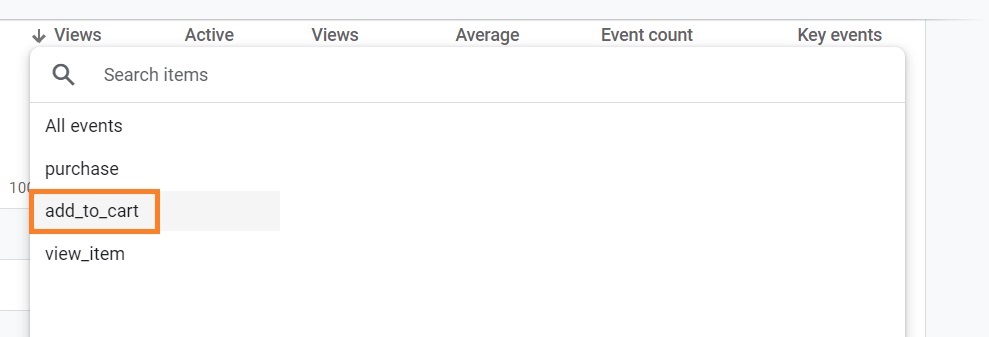
2. Scroll down to the table below the graph. Click the arrow next to the “Key events” header – this will sort it in descending order. Then, select the All events option.
3. Here you can choose any key event that you want to examine and compare it to other statistics. You can choose the add_to_cart option to monitor the number of add-to-cart actions on different pages.
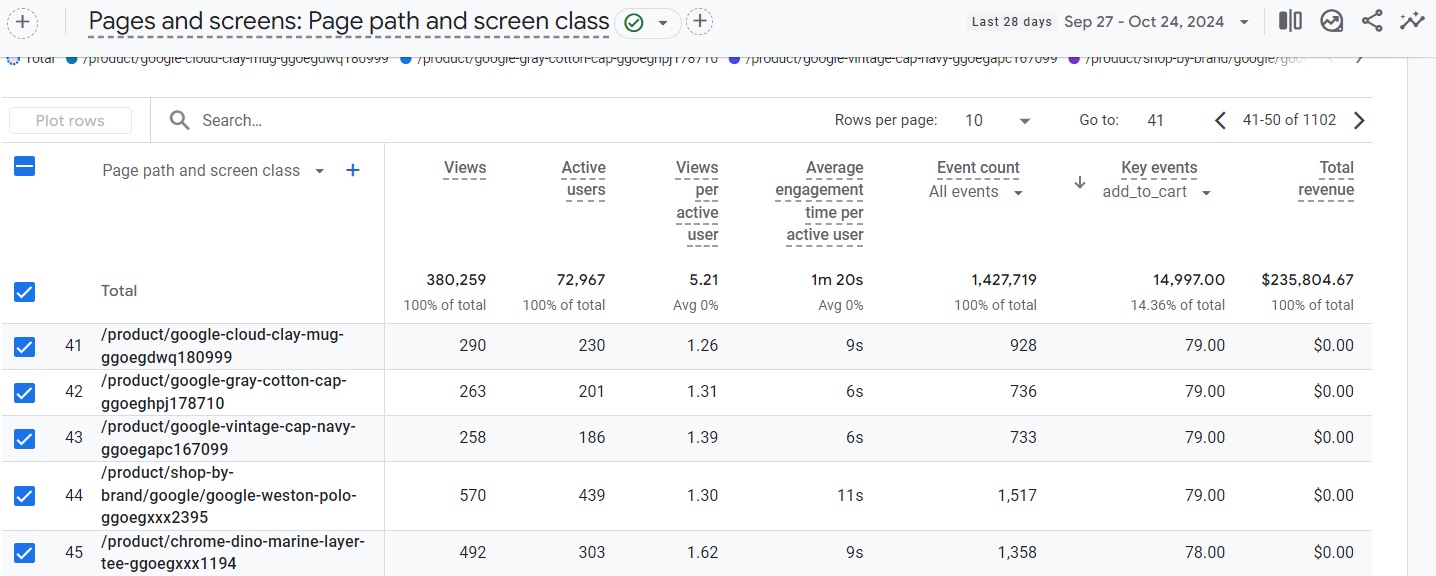
4. You can use the presented data to compare your key events (how many times people add your product to the cart) to your traffic (views).
For example, let’s take the Google Demo account. From the table below, we can see that the 44th page has almost double the views compared to the 43rd, but the key event count is similar.
This means that the 43rd page in the table has 30.62% of key events per views, while with double the views, 44th has only around 13.86%. This means it’s a good opportunity to look for what to improve in the 44th page. Yet, it may not always be because of SEO, so make sure you review if there are any issues with the page or if your content could use some optimizations.
Method 4: Find keyword opportunities through the internal website search
Google Analytics lets you find out what users are looking for using the search bar on your website. You can use this information to up your marketing strategy and create content that actually matters to your audience.
Here’s how to use GA4 to find what your users are searching for:
1. Open Reports > Engagement > Events.
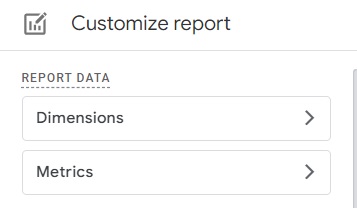
2. At the upper-right corner of the table, click the pencil icon to customize the report.
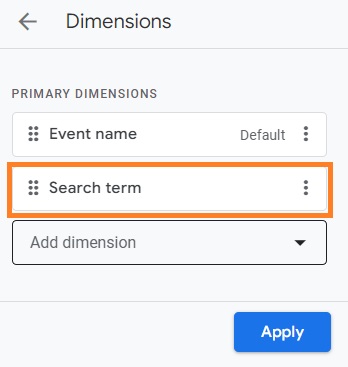
3. Click Dimensions.
4. Press Add dimension.
5. Type in “Search term” and click the option once it appears and press Apply.
6. All that’s left to do is Save > Save changes to current report.
7. Now, you’ll be able to see the search data by clicking the arrow by the “Event name” section and choosing the “Search term” dimension.
That’s all – now that you know the commonly used search terms on your website, you can use these keywords to update your older content or create new articles.
Method 5: Set up data anomaly alerts
In Google Analytics, you can create alerts and set up email notifications. This is useful when you want to track any unexpected increase or decrease in SEO metrics, such as traffic, conversion rates, daily revenue, and more.
Let’s say you want to track conversion rates, so you set up an alert on Google Analytics. Then, one day your conversion rates drop by 30%, and you get a trigger email about it. This way, you can instantly review any potential issues and act upon any drastic changes to get ahead of the problem.
Setting up custom alerts can also help you detect such issues as broken links, increased bounce rates, and more.
You can create alerts on Google Analytics by following this tutorial:
1. Go to the Home section of Google Analytics and scroll down to the “Insights & recommendations” section.
2. Press Create (you need admin permissions for that) or See suggested insights if you don’t have any yet.
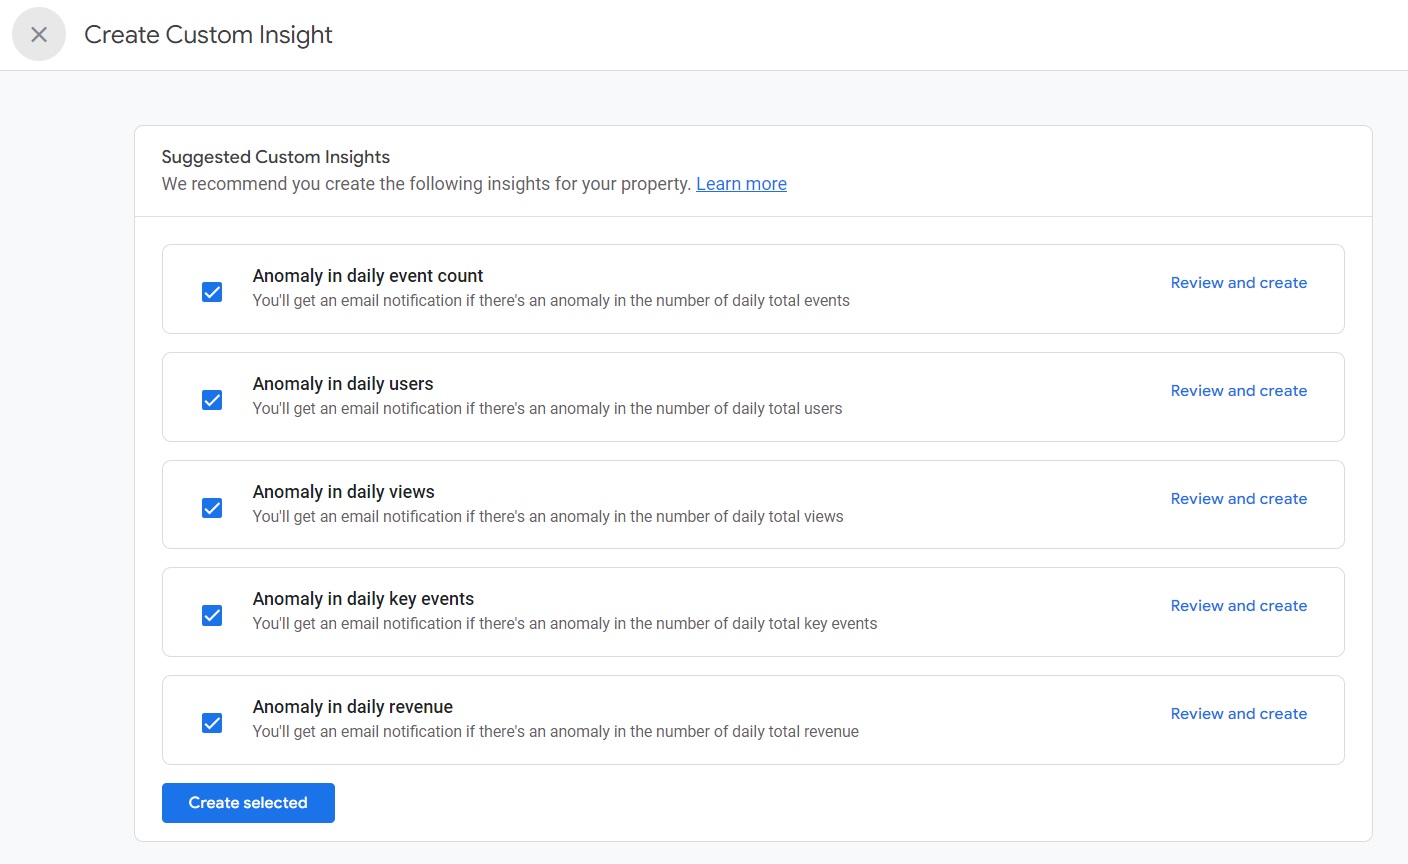
3. Google Analytics will show you suggested custom insights, including anomalies in daily event count, users, views, key events, or revenue. You can choose to monitor whatever you find useful. We recommend picking daily users and key events.
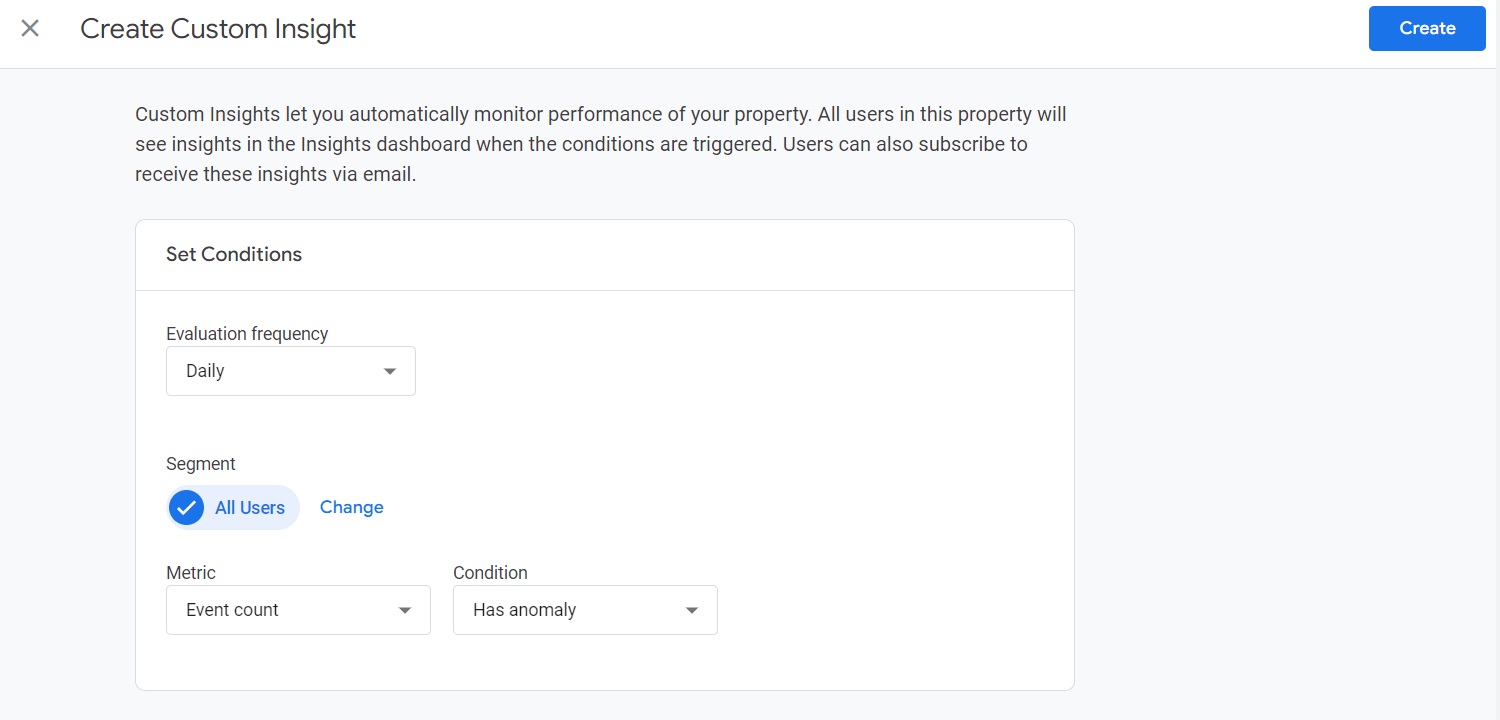
4. You can also click the “Review and create” buttons by each insight to edit it. This lets you set evaluation conditions, insight name, and email notifications. Once done, click Create.
When you press “Create” or “See suggested insights” if you don’t have any insights yet, you can scroll down the window and create custom alerts. Simply click “Create new” under the “Start from scratch” section. Insert the alert name, conditions, frequency, and email.
How to improve SEO with Google Analytics data?
Whether you’re trying to increase conversion rates, engagement, or anything else you found wrong when analyzing Google Analytics SEO data, you need to know what you can improve. Here are some useful SEO tips for page optimization:
- Make URLs SEO-friendly. Place a target keyword in your page URL to clearly state the main topic of your article, don’t make it too long, and make sure you don’t forget to separate the words by hyphens.
- Optimize images. Slow loading time can contribute to higher bounce rates, so use tools like TinyIMG for Shopify which compresses images automatically in bulk to reduce page weight and improve site speed.
- Review content. Content that doesn’t match the user intent or has outdated facts can cause low average engagement time. Make sure you perform keyword research and optimize your copy. For product descriptions, focus on the benefits for the user rather than just technical features.
- Improve Core Web Vitals. Go to PageSpeed Insights, insert your page URL, and check whether your page has passed the Core Web Vitals test. Improving the metrics can assist with enhancing your SEO ranking as well as reducing bounce rates.
- Optimize mobile experience. According to Statista, in the last quarter of 2023, mobile traffic made up over 54% of all website traffic globally. That’s more than half compared with all other devices, so ensure your pages are mobile-friendly in terms of design, usability, and performance.
That’s not all – there are many ways you can improve your page SEO. You can fix broken links by redirecting them and improve website performance by enabling lazy loading and asset preloading. You may leverage tools like TinyIMG on Shopify to automate many tedious SEO tasks like this.
How to monitor SEO optimization results on GA?
When you optimize your website SEO based on the data provided by Google Analytics, you should also monitor the results of your optimization. This helps you understand if you’re going in the right direction.
For this, it’s crucial to take notes with dates on when you optimize certain pages. You can do it by creating an Excel sheet, notes pad, or any other tool that’s convenient for you.
Then, depending on the reports you analyzed during your Google Analytics SEO optimization, go back to them a month or a few later.
For example, if you find pages that have dropped in average position in the Google organic search traffic report, return to it and check changes by selecting a custom date range. Here’s how to do it:
1. Open the report you want to check. In the upper-right corner, click the arrow by the date.
2. Toggle on the compare button and click “Preceding period (match day of week).” On the first start date, enter the date you made the changes. The end day should be today. The comparison date will automatically be set to the previous period.
By setting a custom date, you can view whether your metrics improved or declined, giving you insights into whether your new SEO or content strategy works.
Conclusion
Google Analytics 4 is a great free tool for analyzing SEO data. You can find content that doesn’t perform well, set up data anomaly alerts, find keyword opportunities, and discover high-view low-engagement or low-conversion rate pages.
Using the data to update your pages with the best SEO practices like optimizing images, mobile user experience, speed, and content can get your pages up in those search results in no time.
The best part – you can automate most of such SEO tasks with the TinyIMG app on Shopify. It’s a comprehensive SEO tool that lets you quickly compress loads of visuals, improve page speed in a few clicks, fix broken links, edit metadata in bulk, and much more.
Interested to find out more? Read these articles:

Frequently asked questions
Start by connecting your Search Console account to Google Analytics. In your Google Analytics account, go to Reports > Search Console > Queries. Below the graph, you’ll see a table with organic Google Search queries and their clicks, impressions, click-through rate, and average position.
There are various ways you can leverage Google Analytics to increase traffic, like connecting your Search Console account and analyzing the Queries report to see what keywords need to be worked on. You may also use the “Google organic search traffic” report to find what pages underperform in terms of clicks and other metrics.
You can use Google Analytics for SEO by looking up what content began underperforming in the past few months that you could optimize and search for keywords that users look for in your internal search bar. You may also improve conversion rates by comparing it to the number of views your page gets.
You can use Google Search Console for SEO by analyzing queries (keywords), finding indexing issues in the URL inspection tool, discovering Core Web Vitals or HTTPS usage issues on the Page Experience report, and finding sitemap fetch or parsing errors in the Sitemaps report.
